Hot tubs are a major commodity throughout the United States, accounting for a growing percentage of outdoor amenities among homeowners. The global hot tub market is largely dominated by consumers in North America, and approximately 64% of consumers are residential hot tub owners. However, market trends are slowly gravitating towards commercial uses for hot tubs, including vacation rentals and spas.
U.S. Hot Tub Market Size
The global hot tub market has been growing steadily in recent years. As of 2025, the market for hot tubs was valued at $5.76 billion USD by Fortune Business Insights [1], while Mordor Intelligence valued it at $5.12 billion USD [2].
Current evaluations by Fortune Business Insights indicate that, in 2026, the hot tub market increased in total valuation to $6.06 billion USD [1]. This growth represents a stable increase based on advancements in hot tub technology and an increase in demand for personal care utilities to promote rehabilitation and wellness, a key market demographic for hot tubs [1].
Hot Tub Market Projected Growth in 2026
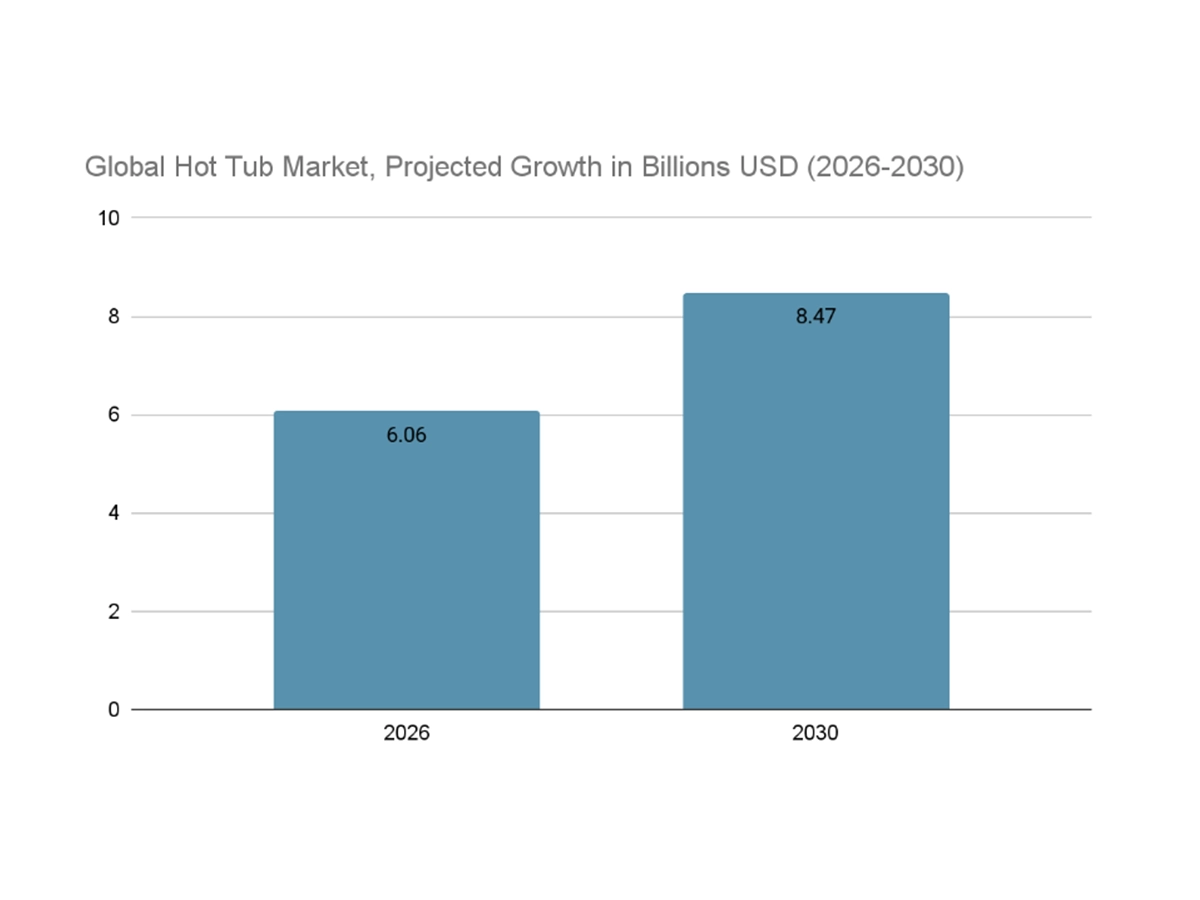
The global hot tub market is projected to grow from $6.06 billion USD in 2026 to $8.47 billion USD in 2030, exhibiting a CAGR of 4.28% [1]. This steady growth rate corresponds to increased consumer demand for home wellness products and upgrades to outdoor living amenities [2]. Data shows that the increased integration of energy-efficient features and smart-device connections is also driving an increase in demand for hot tubs [2]. Hot tubs are also becoming a major commodity in the hospitality and vacation rental verticals, and further growth is driven by product innovation in the swim-spa and hydrotherapy industries [2].
Consumer Data
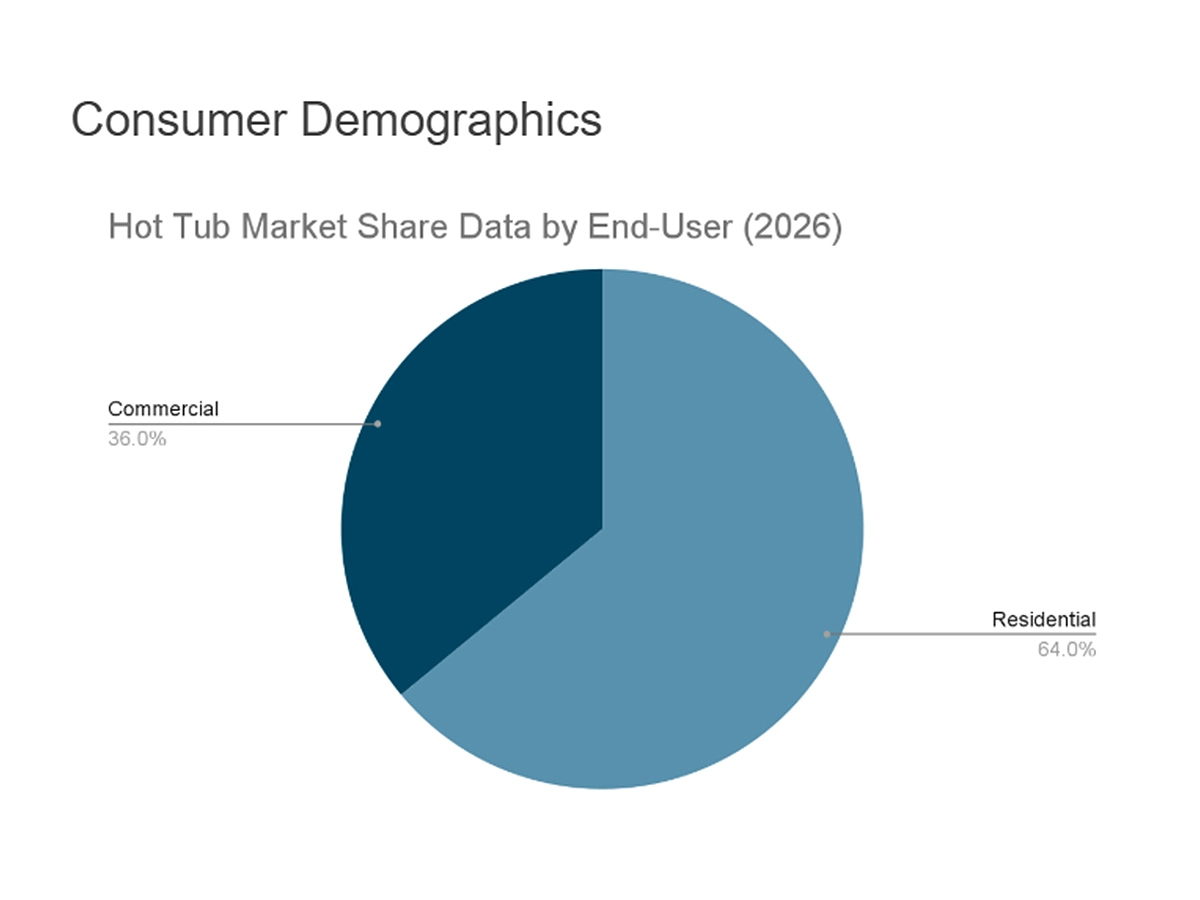
U.S. consumers own approximately 5.8-7.3 million hot tubs as of 2026 [3]. Approximately 64% of revenue is localized to residential end-users, while 36% of revenue is distributed amongst commercial end-users such as vacation rental businesses and spa establishments [2]. By 2030, the CAGR for vacation rental hot tubs is expected to be 5.91%, reflecting a steady market expansion in the commercial hot tub industry.
Household Penetration Rates
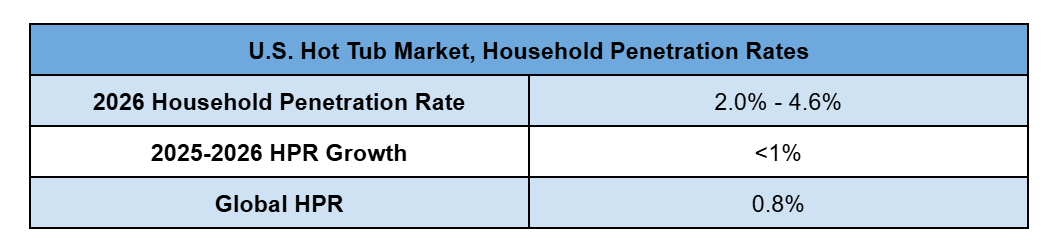
Estimates indicate that anywhere between 2.0% [3] and 4.6% [4] of U.S. households own a hot tub. This represented a less than 1% growth rate in HPR from 2025-2026. Compared to the global household penetration rate of 0.8% for hot tubs, household penetration in North America is fairly robust. According to ConsumerAffairs, most U.S. consumers keep their hot tub for approximately 7.5 years, with a large percentage either selling or giving away their hot tubs after that time [5].
General Sales Trends in the U.S. Hot Tub Market
Market Share by Type
The hot tub market is generally divided into four types:
- Portable Tubs: Portable, acrylic tubs known for greater affordability, convenience,and versatility.
- In-Ground/Fixed Tubs: Fixed or in-ground tubs associated with higher costs but greater durability.
- Inflatable Tubs: Temporary or collapsible tubs designed for less frequent use.
- Swim-Spa Tubs: Large hot tubs designed for swimming, spa treatments, and hydrotherapy.
In 2026, the portable tubs segment dominated the hot tub market with a share of 36.04% [1]. This represented the greater accessibility and affordability of portable hot tubs, as well as their convenience and easy installation [1]. The additional enhancement of many portable tub brands with user-friendly features, smart-device integration, and improved insulation/energy-efficiency provided additional context for the dominance of this segment [1].
Market Share by Material
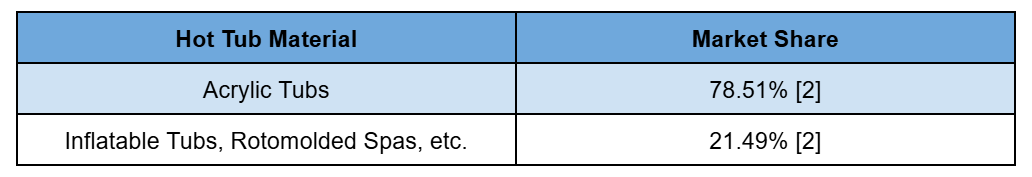
Acrylic tubs dominated the market in terms of hot tub material, with a market share of 78.51% in comparison to other types of hot tub materials [2]. Acrylic tubs offer a variety of benefits, including multi-layer shells, various customizable jets, and even modular cabinet options [2]. LED lighting, Bluetooth sound, and Wi-Fi capabilities can also be integrated into many acrylic tubs, providing additional user value and convenience [2].
Market Share by Distribution Channel

The majority of hot tub consumers purchased their hot tubs from specialty retail stores, which accounted for 54.45% of the hot tub market share by distribution channel in 2026. Other purchase methods, such as online and e-commerce outlets, command approximately 45.55% [2] of market share. However, online purchases of hot tubs are growing, with an estimated CAGR of 4.94% in this segment as of 2026 [2], indicating a greater customer willingness to seek out hot tubs online.
Key Takeaways For Hot Tub Buyers in 2026
- The hot tub market is growing steadily in the U.S., with an estimated valuation of $8.47 billion USD by 2030.
- Hot tub ownership among U.S. households is increasing at a slow rate, while commercial hot tub use is expanding via vacation rentals and spa outlets.
- Portable, acrylic tubs are the best buyer option in 2026, coming with a wide array of features and ideal cost-to-benefit ratios.
- Both retail outlets and online merchants are competing well in terms of hot tub sales.
Conclusion
If you are looking to purchase a hot tub in today’s growing market, Aqua Living offers options for all kinds of buyers, including no-credit and bad-credit applicants, making hot tub ownership accessible to all. Aqua Living is the largest hot tub retailer in the United States, with nearly 100 store locations, an experienced sales team, and the ability to complete purchases remotely by phone or online. Aqua Living holds its teams to exceptional standards, resulting in an average Google rating of 4.76 stars and over 8,000 five-star reviews.
Sources
- Hot Tub Market Size, Share, Trends | Growth Forecast [2034]. (n.d.). https://www.fortunebusinessinsights.com/hot-tub-market-104629
- Intelligence, M. (2025, November 3). Hot Tub Market Analysis | Industry Growth, Size & Forecast Report. Mordor Intelligence. https://www.mordorintelligence.com/industry-reports/hot-tub-market
- Hot tub statistics 2026. (n.d.). Consumer Affairs. https://www.consumeraffairs.com/homeowners/hot-tub-statistics.html
- Staff, P. P. S. F. (2019, May 30). Fast forward: The future of the hot tub market – Power per square foot. Power per Square Foot. https://powerpersquarefoot.com/future-hot-tub-market/
- How many hot tubs are sold each year? 2026. (n.d.). ConsumerAffairs. https://www.consumeraffairs.com/homeowners/how-many-hot-tubs-are-sold-each-year.html